
What was my share of promotions in the sales flyers for week 26 of 2023?
Can this be answered with a number? And what happens when you compare it to last year?
The question can be answered with a number, and an index can also be calculated in relation to last year. But before you are introduced to the methods that can lead you to the share, you should consider the data that forms the basis for the answer.
The data in this article comes from Tjek Insights.
What exactly is “my share”?
A share is how much a subset constitutes of a whole.
Therefore, when considering a share, we must think about what is included in the subset and in the whole. If you, as the brand “Coca-Cola,” want to know what share of promotions you had in week 26, you might look at the following graph from Tjek Insights.
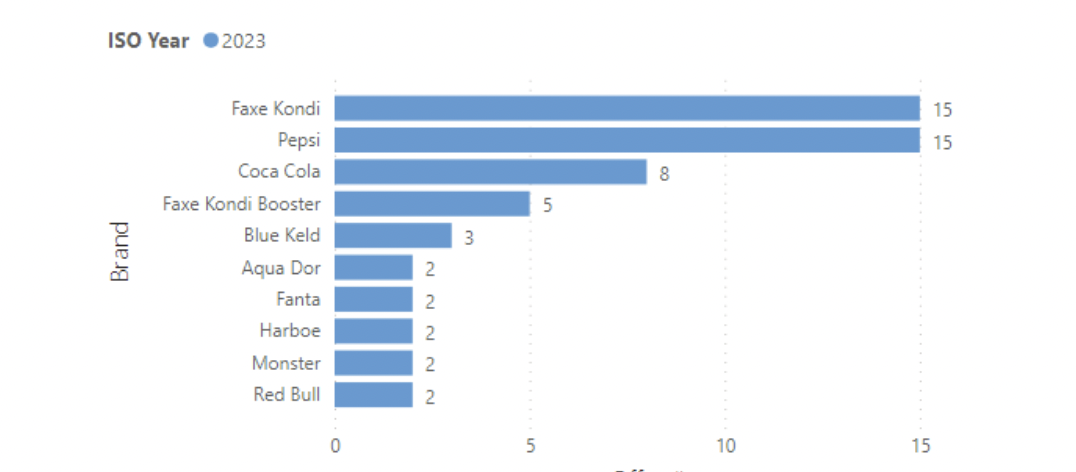
Top 10 Brands by Offer Number
According to Tjek’s data, Coca-Cola has 8 out of 56 offers, which gives a share of 8 / 56 = 14.2%.
But how are these 8 offers actually calculated, and what about the 56 – what exactly does that include?
Let’s take an example – specifically, Netto’s sales flyer for week 26. The flyer covered the period from Saturday, July 1, 2023 (week 26) to Friday, July 6, 2023 (week 27).
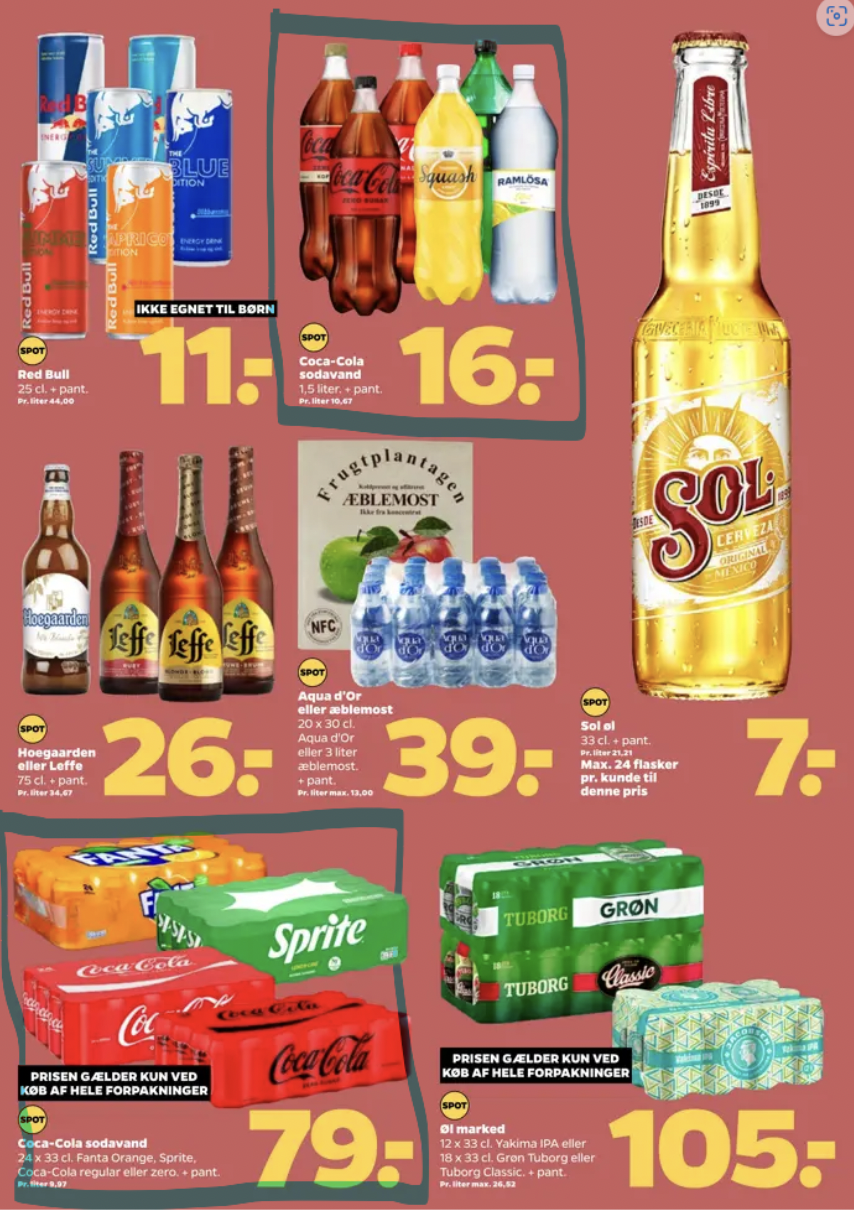
Netto Flyer from Saturday, July 1, 2023 (week 26) to Friday, July 6, 2023 (week 27)
The Netto flyer starting in week 26 and ending on Friday of week 27 looks as shown above.
What is the Coca-Cola brand’s share of the offers?
The Coca-Cola brand is represented with two different price points and packaging (1.5 L for 16 DKK and 24 cans for 79 DKK). Additionally, a range of other brands are included in the offers at these two different price points.
Method 1
On the page, there are 4 price points in the beverage category, so Coca-Cola is represented in 2 of them – hence 2 / 4 – 50%.
So Fanta has 1/4 = 25%
Sprite has 1/4 = 25%
Squash also has 1/4 = 25%
Wait – now the sum of brands is over 100% – can that be right – and yes, if you add up the shares – therefore, you must exclude the totals.
Method 2
What if we give each brand a weighted share of a price point. For the Coca-Cola cans offer at 79 DKK, Coca-Cola represents 2 out of the 4 brands in the price point (including Coca-Cola Zero). Additionally, Coca-Cola’s share is 3 out of 6 products in the 16 DKK price point (1.5 L).
So, we still have 4 price points in the beverage category, where Coca-Cola is included in 2 of the 4 price points. Therefore, we weight each price point with 0.5. Thus, Coca-Cola’s share of the offers is: ((2/4)*0.5) + (3/6)*0.5) = 50%.
This way, the total for the sum of all brands will be 100%.
For offers where many brands are represented in the same offer/price point, such as the 1.5-liter offer, Ramlösa and Squash will also have a share of ((1/6)*0.5) of the offers despite their significance in the category being significantly lower than Coca-Cola’s.
Method 3
Another approach to measuring offers would be to record the total number of brands within beverages (or another category) that are on offer: Red Bull, Coca-Cola (1.5 L), Squash, Carlsberg Sport, Ramlösa, Aqua D’or, Fanta, Sprite, and Coca-Cola (cans). That’s 10 offers in total.
In this case, Coca-Cola’s share of the offers is 2 / 10 = 20%. And I haven’t even accounted for the fact that:
- There are three different variants or Coca-Cola subbrands (Regular, Zero, and Vanilla)
- That Coca-Cola Regular and Zero are on offer in two different packages (1.5 L and 24 cans)
- That the offer on Red Bull includes 6 different variants
NOTE – A weakness of this method is that one must be able to determine from the image and text alone which brands are part of the offer, which unfortunately, as shown, is not always the case.
But wait – what is our promotion share in week 27?
In the current standard method in Tjek, a price point/offer is related to the calendar week when the offer starts – regardless of whether the offer runs for 2 or 28 days.
This means that the promotion share in week 27 does not include the aforementioned offers, and the share is 0 (if no other offers start).
How you should calculate your share of offers going forward
The traditional way of counting promotion weeks can simply no longer be used to create an accurate picture of campaign pressure in the market. This is due to the large variance in how long an offer runs, which can be anything from a day to a month – maybe even longer.
Retailers and suppliers should therefore change their calculation method and switch to counting the number of days a price point for a given brand/product has been active as an offer.
So when chains like Bilka, Føtex, SuperBrugsen, and Kvickly run 14-day sales flyers, it should be calculated as 14 out of 365 days (3.8%) and not 1 out of 52 weeks (1.9%). Month-long offers should be calculated as 28/30/31 offer days out of 365 days, corresponding to 7.7; 8.2, and 8.5% respectively.
Whether the offers your brands appear in should be counted as method 1, 2, or 3, or a completely 4th method is a matter of taste. The most important thing is that the duration of the offer is included in the calculation, and that you revisit your KPI – “Promotion share in sales flyers in our category”.
Fortunately, Tjek Insights is already ready to provide you with these answers.
Example of Promotion Days by Supplier from Tjek Insights
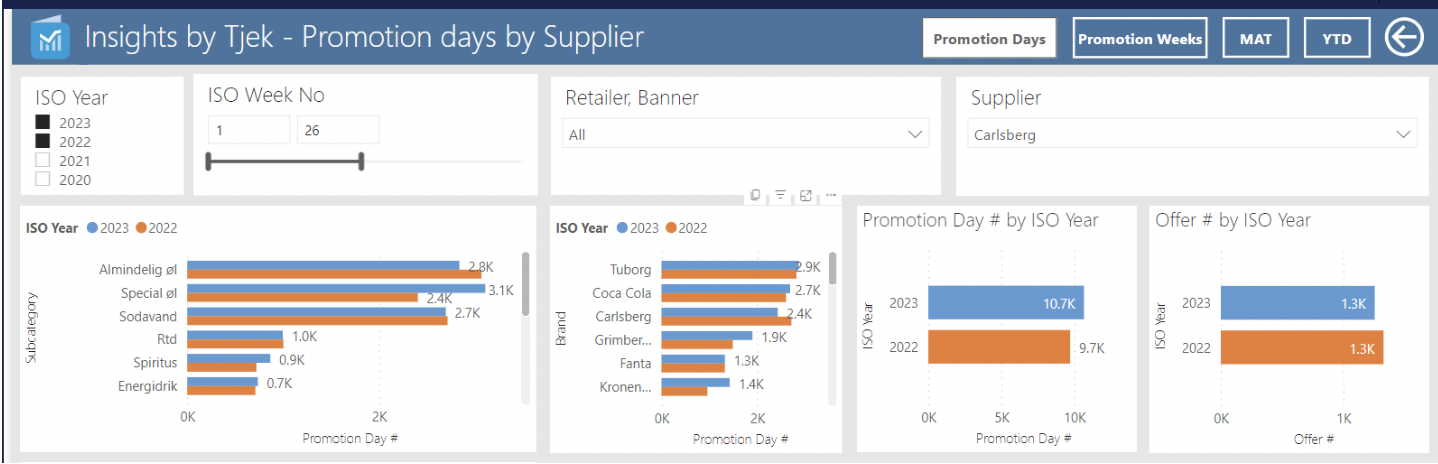
Example of Promotion Days in Tjek Insights.
If you already have access to Tjek Insights, you can test promotion days here.
You are also welcome to contact CatMan Solution to get a trial access.